Your salon business performance is already being tracked. Bookings, paid invoices, no-shows – Minuvox records all of it and turns it into a dashboard you can read at a glance. This guide walks you through each section of that dashboard so you know what the numbers mean and what to do with them.
If you have not set up your Minuvox account yet, start with How to Set Up Online Booking for Your Salon.
Why Your Numbers Matter
Most salon owners have a rough sense of how the business is doing. You know last week was busy because you were on your feet all day. That one service keeps selling out, so it must be popular. But “a rough sense” is not the same as knowing your numbers – and you cannot make good decisions about pricing, staffing, or scheduling without them.
A dashboard turns scattered impressions into patterns. Instead of guessing whether this month was better than last month, you can see it. Instead of assuming your most popular service is the one you do most often, you can check. The numbers do not tell you what to do, but they tell you where to look.
The Dashboard at a Glance
The dashboard is the first page you see after logging in. At the top is a welcome message and a row of time period buttons: Today, This Week, This Month, and This Year. Everything on the page updates when you switch between them.
Below the time period selector, the dashboard is organised into sections:
- KPI cards – four numbers that summarise your revenue and appointments
- Most Popular Services – your top services ranked by booking count
- Today’s Schedule – your next appointments for the day
- Staff Performance – a table showing each staff member’s bookings and revenue
If your account has revenue goals set up, a Revenue Goals section also appears with progress bars.

Reading Your KPI Cards
The four KPI cards sit near the top of the dashboard. Two of them – Total Revenue and Total Appointments – include a growth percentage comparing the current period to the previous one. The other two show supporting context: invoice count and no-show count.
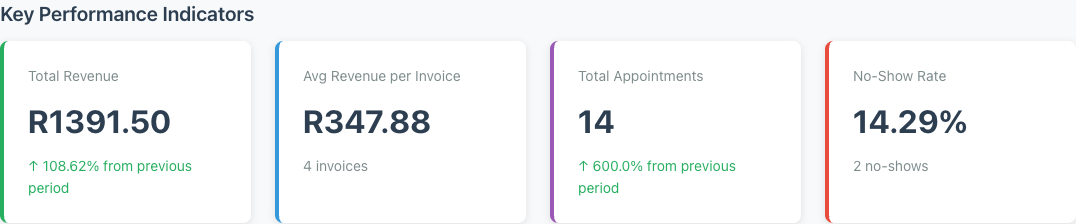
Total Revenue
This is the sum of all your paid invoices in the selected time period. If you are viewing “This Month”, it shows how much money has come in so far this month. A green arrow with a percentage means revenue is up compared to last month. A red arrow means it is down. (For more on how invoicing works, see How to Create Professional Invoices for a Service Business.)
Avg Revenue per Invoice
Total revenue divided by the number of paid invoices. This tells you whether your average ticket size is growing or shrinking. If it drops while total revenue stays flat, you are doing more work for the same money – worth investigating.
Total Appointments
The count of all bookings in the selected period, with a growth percentage compared to the same length of time before. Use this alongside revenue to see whether you are getting busier, and whether the extra bookings are translating into more income.
No-Show Rate
The percentage of bookings marked “No Show” out of total bookings. Minuvox shows both the percentage and the raw count. A rate above 10-15% is worth paying attention to. You cannot eliminate no-shows entirely, but tracking the number is the first step – it tells you whether the problem is getting worse and which time periods are most affected.
How the comparison works: When you select “This Month”, the growth arrows compare to the previous month. “This Week” compares to last week. “Today” compares to yesterday. “This Year” compares to last year.
Which Services Are Your Clients Booking Most
The Most Popular Services section shows up to five services ranked by how many times they were booked in the selected period. Cancelled and no-show bookings are excluded – this reflects real demand, not just calendar entries.
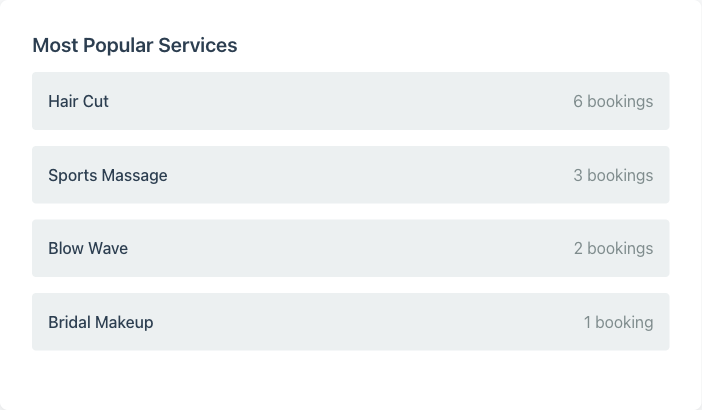
A service that consistently ranks at the top tells you where your demand is strongest – make sure you have enough staff and supplies for it. On the other hand, a service you expected to be popular that barely appears might need a pricing adjustment or more visibility. This section is also worth checking before you add a new offering, since it shows what your clients are already choosing.
For background on how services are set up in Minuvox, see How to Organise Your Services with Categories and Pricing.
Checking Today’s Schedule
The Today’s Schedule widget shows up to five upcoming appointments for the rest of the day. Cancelled and no-show bookings do not appear. Each entry shows the time and the client name.
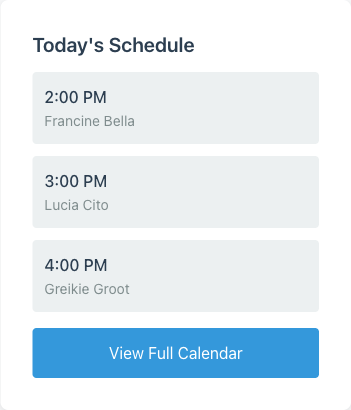
This is designed for a quick morning check – open the dashboard, see what is coming up, and get on with your day. If you need the full picture, the View Full Calendar link at the bottom takes you to the calendar page. (For more on managing your staff calendar, see Staff Scheduling for Small Service Businesses.)
Comparing Staff Performance
The Staff Performance table shows each staff member who had bookings in the selected period, with two columns: their appointment count and their revenue for the selected period. It is sorted by appointment count, highest first.
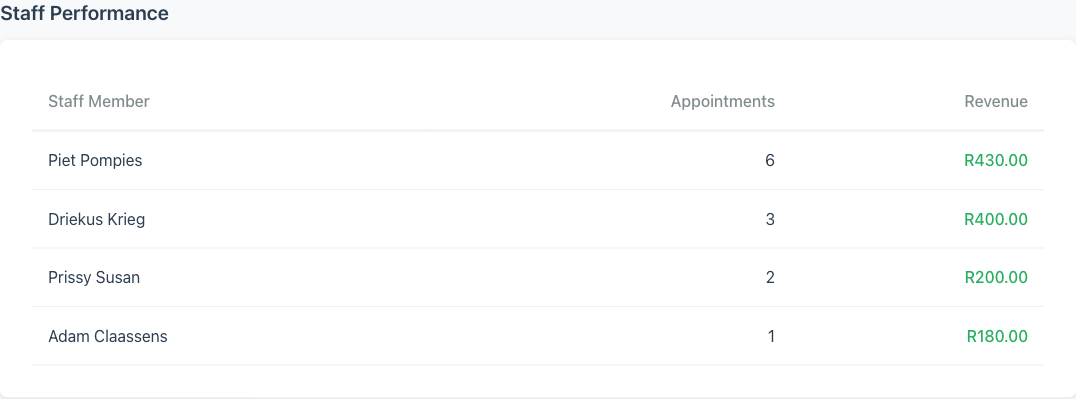
Revenue here comes from paid invoice items that are attributed to each staff member. If a staff member has many appointments but low revenue, they may be doing shorter or lower-cost services. If another has fewer appointments but higher revenue, they may specialise in premium services. Neither is necessarily a problem – but the numbers help you see the pattern and make scheduling decisions accordingly.
Switch to “This Year” to see cumulative performance. Switch to “This Week” to check the current workload balance.
Revenue Goals
If your account has revenue goals configured, the dashboard shows them between the KPI cards and the Popular Services section. You will see a progress bar for each goal – monthly, yearly, or both – with the actual revenue, the target, and a percentage. When a goal is reached, it is marked as achieved.
Revenue goals are configured by your account administrator – there is no self-service form for creating them on the dashboard. If you do not see this section, no goals are currently active for your account.
Switching Time Periods to Spot Trends
The time period selector is the most useful control on the dashboard. Here is a practical routine:
Start your day with “Today”. Check your upcoming schedule and see how today’s numbers are shaping up.
Check “This Week” midweek. Are you on pace with appointments, and has anything shifted since last week?
Review “This Month” at the end of each month. This is your main performance snapshot. Compare revenue, appointments, and no-show rate to the previous month. If something moved significantly, look at the Popular Services and Staff Performance sections for clues.
Use “This Year” for the big picture. Annual numbers smooth out weekly and monthly noise. This is where you spot long-term trends in revenue, appointment volume, and no-show rates.
The growth percentages change with each period because the comparison window changes. A 20% increase “This Week” means you are up 20% compared to last week. The same metric might show a different percentage for “This Month” because the comparison period is different.
What the Dashboard Does Not Show
The dashboard gives you a solid overview, but it has limits.
There are no graphs or charts. All metrics are displayed as numbers and tables. If you want to visualise trends over time, you would need to note the numbers down periodically and chart them yourself.
There is no per-client booking history view. You can see that a client exists (in the Clients section), but the dashboard does not show “this client’s past appointments” in one place.
The no-show rate is the only booking status metric shown on the dashboard. Minuvox tracks seven booking statuses internally (Scheduled, Confirmed, Arrived, In Progress, Completed, Cancelled, No Show), but the dashboard surfaces only the no-show count and rate. The full status breakdown is not displayed.
For a broader view of what Minuvox offers beyond the dashboard, see the features overview.
Start Checking Your Numbers
If you are already using Minuvox, click Dashboard in the sidebar – or just log in, since the dashboard is your landing page. Switch to “This Month” and spend two minutes reading the numbers. That is enough to know whether you are up or down on revenue, which services are driving your bookings, and whether no-shows are becoming a problem.
If you have not signed up yet, How to Set Up Online Booking for Your Salon will walk you through the full setup in about five minutes.
About the author: Adam Claassens is the founder and developer of Minuvox. He built the platform to make professional booking tools accessible to small service businesses that cannot afford expensive monthly subscriptions.
This article was drafted with AI assistance and reviewed, fact-checked, and edited by the Minuvox team.